
More RAM only helps against Minecraft lag if memory pressure is actually the cause. Low client FPS, an overloaded server tick, and an unstable connection are different problems. Measure while the lag is happening, check tick times, and then examine the matching call path in the spark report. Change one thing and repeat the same test. Only that follow-up measurement shows whether your explanation holds up.
Learn to read spark reports.
MCRedstone guide · Sources checked November 1, 2026 · For Minecraft: Java Edition, especially Paper. For players with any host and for self-hosted servers.
Case study status: Each of the three case studies now ends with its own controlled lab measurement from October 29, 2026: a raw spark profile under load, an excerpt of it in the spark viewer, and a follow-up measurement without that load. The loads were deliberately artificial, and no players were connected. The numbers show what these mechanisms look like in a report. They are not a comparison of hosts or hardware. The setup and its limits are described in the “Our Lab” section.
First, Find Out What Is Actually Lagging
You gave the server more memory. Still, blocks pause for a moment, mobs move in jerks, or holes appear in the landscape while you fly. That is frustrating, but it is not yet a diagnosis. RAM is storage for data. It does not tell you how fast the CPU computes the world, how smoothly your computer draws frames, or how reliably packets travel between you and the server.
Start by describing the symptom as something you can observe: “After I mine a block, it reappears,” “The picture stutters when I turn the camera,” or “All players freeze at the same time.” Note the time, the world, and what you were doing. Ask another player whether they saw the same thing at the same moment. This small cross-check is often more useful than yet another generic optimization list.
Client FPS: Your Computer Draws Too Slowly
If even camera pans are uneven, but the menu responds and other players keep playing normally, start on your own computer. First compare the same view without shaders and with a lower render distance. Don’t change your resource pack, resolution, mods, and Java settings at the same time; otherwise you won’t know afterward which change helped.
A server profile cannot explain the rendering work of your graphics card. Even in singleplayer, game simulation and rendering are two separate tasks, although both run on the same computer. Low FPS can occur alongside healthy server ticks. Conversely, the camera can move smoothly while the game world waits for the next server response.
Server Load: The Shared World Can’t Keep Up
If several players see delayed block actions, slow animals, or stuttering redstone contraptions at the same time, check the server’s tick times. The normal target rate is 20 ticks per second. That corresponds to an average of no more than 50 milliseconds of processing time per tick. Occasional longer ticks and consistently high tick times are different failure patterns. Source: spark on TPS and MSPT.
One important caveat: not every world runs under the same conditions. This guide assumes the usual tick rate and a classic Paper server. Modified tick rates, Folia with its regionalized execution, and unusual modpack architectures need an adapted interpretation. Don’t blindly apply the name “Server thread” to every platform.
Connection: Packets Arrive Late or Irregularly
If only one player gets rubber-banded back while the others play the same spot normally, check that player’s connection. Compare Wi-Fi with a cable, and a quiet moment with a moment when an upload is running at the same time. High latency, strong fluctuations, and packet loss are not the same metric. A single ping is not a complete connection test.
Here too, the pattern points in a direction; it is not proof. A server can affect individual players differently through certain plugins or regions. Only a simultaneous comparison of in-game observation and server measurement helps tell these possibilities apart. A healthy spark report from a different hour does not clear the server for this incident.
What “Enough RAM” Really Means
A readout like “8 GB allocated” primarily describes a limit. It proves neither a memory shortage nor sufficient headroom. Distinguish between the Java heap, the entire Java process, and the memory limit of the container or operating system. Besides the heap, threads and native libraries, among other things, need room. So the maximum heap size should not be set to the full available memory without thinking it through.
“A lot in use” is not a defect on its own either. Java manages memory and frees unused objects through garbage collection. For a diagnosis, what matters is whether garbage collection lines up in time with the lag, whether used memory drops again after collections, and whether the system is also under memory pressure. Paper also warns against reading high memory usage in isolation as a problem. Source: Paper: Basic troubleshooting.
Ask yourself three separate questions:
- Does the world fit into the memory it has been given? Signs are repeated memory errors or evidence of memory pressure, not just a full bar.
- Does an activity use too much processing time? Tick times and call paths are what matter here.
- Is the amount of data unnecessarily large? A very large number of loaded areas, entities, or poorly bounded caches can strain both memory and processing time.
More memory can make sense in the first case. In the second case, it often doesn’t fix the bottleneck. In the third case, it can push a symptom elsewhere without removing the cause. An upgrade is therefore one possible measure at the end of a diagnosis, not a prerequisite for it. The same logic applies to a local server as to a rented one.
Why spark Instead of an Old Timings Guide?
Paper recommends spark as its diagnostic tool and has bundled it since Paper 1.21. The current profiling documentation describes Timings as deprecated and names spark as the preferred way. An older guide built on Timings commands is therefore not a good starting point for a new Paper diagnosis. Source and version reference: Paper: Profiling.
First check which server platform and version are actually installed. A Fabric or NeoForge modpack does not become compatible because you drop in a Paper plugin. For a different platform, use the matching spark installation. On an existing Paper server, don’t install a second copy just in case: first find out whether spark is already available and which build is running.
As a regular player without admin rights, you can provide the observation, but you may not be able to start a server profiler yourself. Send the server owner the exact time, the location, and a reproducible action. You don’t need to be a customer of any particular host for this. The following steps work in any suitable server console; in-game, you need the appropriate permissions.
Preparing a Useful Measurement
A profile is a sample of the running program. It answers what the observed threads were busy with during that period. It is not a recording of your entire session and not an automatic repair report. An empty server sitting idle can’t explain, after the fact, the load from a busy farm in the evening.
Before measuring, write a short note. It doesn’t have to be pretty, but it should be complete enough that you can repeat the test:
Date, time, and time zone:
Server platform and exact build:
Minecraft version / Java version / spark version:
Heap limit and total memory limit:
World, dimension, player count:
View distance and simulation distance:
Activity and exact problem observed:
Profile start and profile end:
Normal profile or slow ticks only:
Change compared with the previous test:
Also note running backups, map renderers, or other scheduled work. Not every task running at the same time is to blame. Without this note, though, you can easily mistake a periodic background job for the farm you are testing. On shared hardware, conditions outside the Minecraft process can also affect the measurement.
Pick a limited time window in which the problem usually occurs. Repeatable events can often be investigated with a short measurement; rare hitches need a longer observation period. A long recording is not automatically better: averaging can hide the interesting part. Write down exactly when within the profile the lag spike happened.
The Basic Commands
The examples are in-game commands with a slash. In a direct server console, you usually enter them without the leading slash. For unfamiliar subcommands, check the help of your installed version.
/spark tps
/spark profiler info
/spark profiler start --timeout 120
Here, 120 is a chosen two-minute diagnostic window, not a general minimum duration. If the problem doesn’t occur within it, the test tells you nothing about that problem. Paper’s guide also shows a ten-minute recording with --timeout 600. Don’t stop a running profiler without checking whether another admin is already using it for their own investigation.
For stopping manually and saving a local copy, there are documented variants:
/spark profiler stop
/spark profiler stop --save-to-file
A normal stop gives you a viewer link; --save-to-file saves locally instead. Before uploading, think about which server information you want to share. Check the report and any accompanying logs before sharing them publicly. Don’t claim across the board that a profile can never contain sensitive metadata. Command reference: spark Command Usage.
Finding Short Spikes
Sometimes the world runs well almost all the time and only hangs briefly now and then. In that case, a separate look at slow ticks helps:
/spark tickmonitor --threshold-tick 50
/spark profiler start --timeout 120 --only-ticks-over 50
The threshold is a deliberate choice. The filtered report describes only the slow ticks it captured; it is not a representative average of the whole session. So keep an unfiltered comparison profile as well. Otherwise, you may mistake a rare outlier for a constant load. The spark guide explains this distinction with its own WorldEdit example: Finding lag spikes.
Reading a spark Report in a Sensible Order
Don’t start with the first red or large percentage you see. First read the context: the right server, the right version, the right time span, and the type of recording chosen. Then confirm that the lag you observed actually happened during this recording. Only then is it worth searching the call tree.
Tick Times Before Blame
TPS describes how many ticks happen; MSPT describes how long they take. A server at 20 TPS can still have little headroom or show individual spikes. So besides the median, also read the 95th percentile and the maximum, as far as the view in question shows them. The 95th percentile marks the upper bound for roughly 95 percent of the measured tick durations; the slowest outliers can lie well above it.
A single high maximum is something different from many slow ticks. Compare similar time windows and record the distribution. A good average alone doesn’t explain short freezes. Likewise, a high maximum without a repeatable in-game problem doesn’t prove a permanently overloaded server.
From the Thread to a Specific Path
In a classic server profile, open the relevant thread and expand the larger branches. Follow the path until you can recognize a specific activity. General framework methods often only tell you that the server is running. What’s more telling is which work happens below them and who calls it.
A parent node contains the work of its child calls. So don’t simply add up all the visible percentages in a column. That would be like adding up the total of a shopping cart and then adding every item in it again. In the normal tree view, spark shows the shares relative to the respective thread; with a different selection or view, you have to check the reference again.
The viewer documentation also distinguishes between total time and self time. Total time includes child calls; self time covers the work in the method itself. The Sources view can group plugin and mod paths. It is a starting point for attribution, not an independent verdict. Source: spark: Using the viewer.
Percentages Are Not an Upgrade Forecast
A large share doesn’t prove that uninstalling would win back the same percentage. The path may contain necessary work that then happens somewhere else. Shares also change as soon as the total duration changes. So a smaller percentage after a change is no proof of success without absolute tick times and a comparable load.
Pay attention to the kind of execution. Sleeping until the next scheduled tick is normal. Waiting on a slow dependency during necessary work, on the other hand, can be a problem. Just seeing the method name “wait” or “park” is not enough: you need the parent call path, the state of the server, and the timing.
Method names differ by version and name mapping. Don’t search only for a word from an old screenshot. Read what the path does. If names look unintelligible, check the mappings in the viewer. An honest technical description might be: “The path fits chunk work; the exact triggering action is not yet proven.”
Our Lab: Three Cases, Measured Ourselves
So that the three case studies don’t stay purely theoretical, we recreated each case on October 29, 2026, on our own isolated test server and measured it with spark. One important note up front: the load was deliberately artificial and intentionally unambiguous. No players were connected.
- Software: Paper 1.21.11 build 132 with the bundled spark, Java 21 (Temurin 21.0.13). This is a deliberately chosen, stable lab version, not the latest Minecraft version.
- Environment: a Linux container on our own test machine, with a job limit of 2 CPU cores and 4 GB of memory, and a Java heap of at most 2 GB. The server was reachable only locally; authentication and the whitelist stayed enabled. A new world with a fixed seed, view and simulation distance 3.
- Measurement: one all-threads profile per condition (
/spark profiler start --thread *), about 48 seconds long, saved with/spark profiler stop --save-to-file. In addition,/spark tpsat the start and end of each window. - Procedure per case: first a profile with the load switched on, then switch the load off and, after ten seconds, take a second profile under otherwise identical conditions.
Our main figure is the number of ticks spark counted in the saved profile for exactly that time window. A healthy server manages 20 ticks per second, so about 960 in 48 seconds. We list the /spark tps readings only as a supplement, because their rolling values can include ticks from before the window. Raw values and checksums for the six profiles are in the measurement log.
Limits: 500 villagers are not a general upper limit, 65 ms of plugin work is not a typical value, and switching off an artificial generator is not a measured view distance optimization. We measured each condition once, without repetition. The test container shared the machine with other work. These measurements say nothing about client FPS, the network, or behavior with real players.
Case Study A: Lag in New Chunks
A diagnostic exercise, with our own lab measurement at the end of the section. Several players are exploring new terrain. At the old base, the world runs smoothly; when traveling fast, actions are delayed. The working hypothesis: generating or serving new areas of the world is straining the server. The symptom alone, however, does not distinguish between generation, reading existing data, sending to clients, and client-side rendering.
How to Set Up a Meaningful Comparison
Start in an existing region of the world. Note the route, player count, speed, and settings. Record a normal profile. Then repeat a comparable movement through terrain that hasn’t been generated yet. With your own test copy, you can restore the same starting state so that repeated tests really involve new chunks. Simply flying through the same landscape a second time would already be a different test.
Avoid other experiments in the meantime: no map renderer running at the same time, no additional world pregeneration, and no spur-of-the-moment doubling of the view distance. If that kind of work is part of normal operation, document it as a separate condition. A synthetic load test without players does not automatically prove how a real group of explorers behaves.
What to Look for in the Report
Examine paths around chunk generation and chunk serving. Paper also uses workers for parallel generation, so looking only at the main thread can hide context. The global configuration reference distinguishes, among other things, between load, generation, and send rates. These are different activities with different limits: Paper Global Configuration.
A prominent generation path during the new route supports the hypothesis. It does not yet prove that the problem is purely CPU time. If the main thread is waiting, results it needs from other work may be missing. If tick times stay healthy and only the landscape visibly loads in late, you also need to look at transmission and the client.
One Change and a Clean Way Back
First, test a smaller server-side view distance under otherwise identical conditions. Back up the relevant configuration beforehand and note the old value. View distance describes how much world data is sent; simulation distance concerns active simulation and is a different lever. The exact meaning and valid values are in Paper server.properties.
World pregeneration can be another option, but it shifts work to a different time and needs storage space. It is neither free nor a remedy for every entity or plugin load. Plan the radius, disk headroom, and stop conditions before you use it on a real server. Don’t delete region files to “test fresh”: you would put built parts of the world at risk.
Success criterion: On a comparable new route, the conspicuous tick spikes are rarer or shorter, and players notice less delay. At the same time, the lower view distance remains acceptable for gameplay. If only the second run goes better, reuse of already generated chunks is a plausible alternative explanation. If there is no benefit, restore the backed-up value.
Our Lab Measurement
In the lab, a small test plugin requested a distant, never-generated chunk synchronously on the main thread every tick. That is deliberately worse than real player movement, but it makes the mechanism clearly visible.
| Measurement window | Duration | Ticks in window | Ticks per second |
|---|---|---|---|
| Chunk workload on | 46.4 s | 27 | 0.6 |
| Chunk workload off | 48.2 s | 961 | 19.9 |
In the profile of the load phase, 87.8% of the Server thread sample time sat in a single path: the test plugin’s scheduled task → CraftWorld.getChunkAt → ServerChunkCache.getChunk → syncLoad → managedBlock. So the main thread spent most of its time waiting for the requested chunk to be ready. The actual generation ran in the four Paper Common Worker threads: there, 15.2 seconds of sample time went to ChunkStatusTasks.generateNoise and NoiseBasedChunkGenerator.fillFromNoise. Shortly before the profile window, a single tick took 13.6 seconds, and Paper logged the watchdog message “The server has not responded for 10 seconds” with exactly this loading path in the stack. In just over a minute of load, only 33 new chunks were created.
This is what that path looks like in the spark viewer. We opened the raw profile, typed “syncload” into the search box at the top, and expanded the Server thread. The viewer then shows only the branches that lead to the search term. That way, you can quickly find a suspected path again even in a large tree.
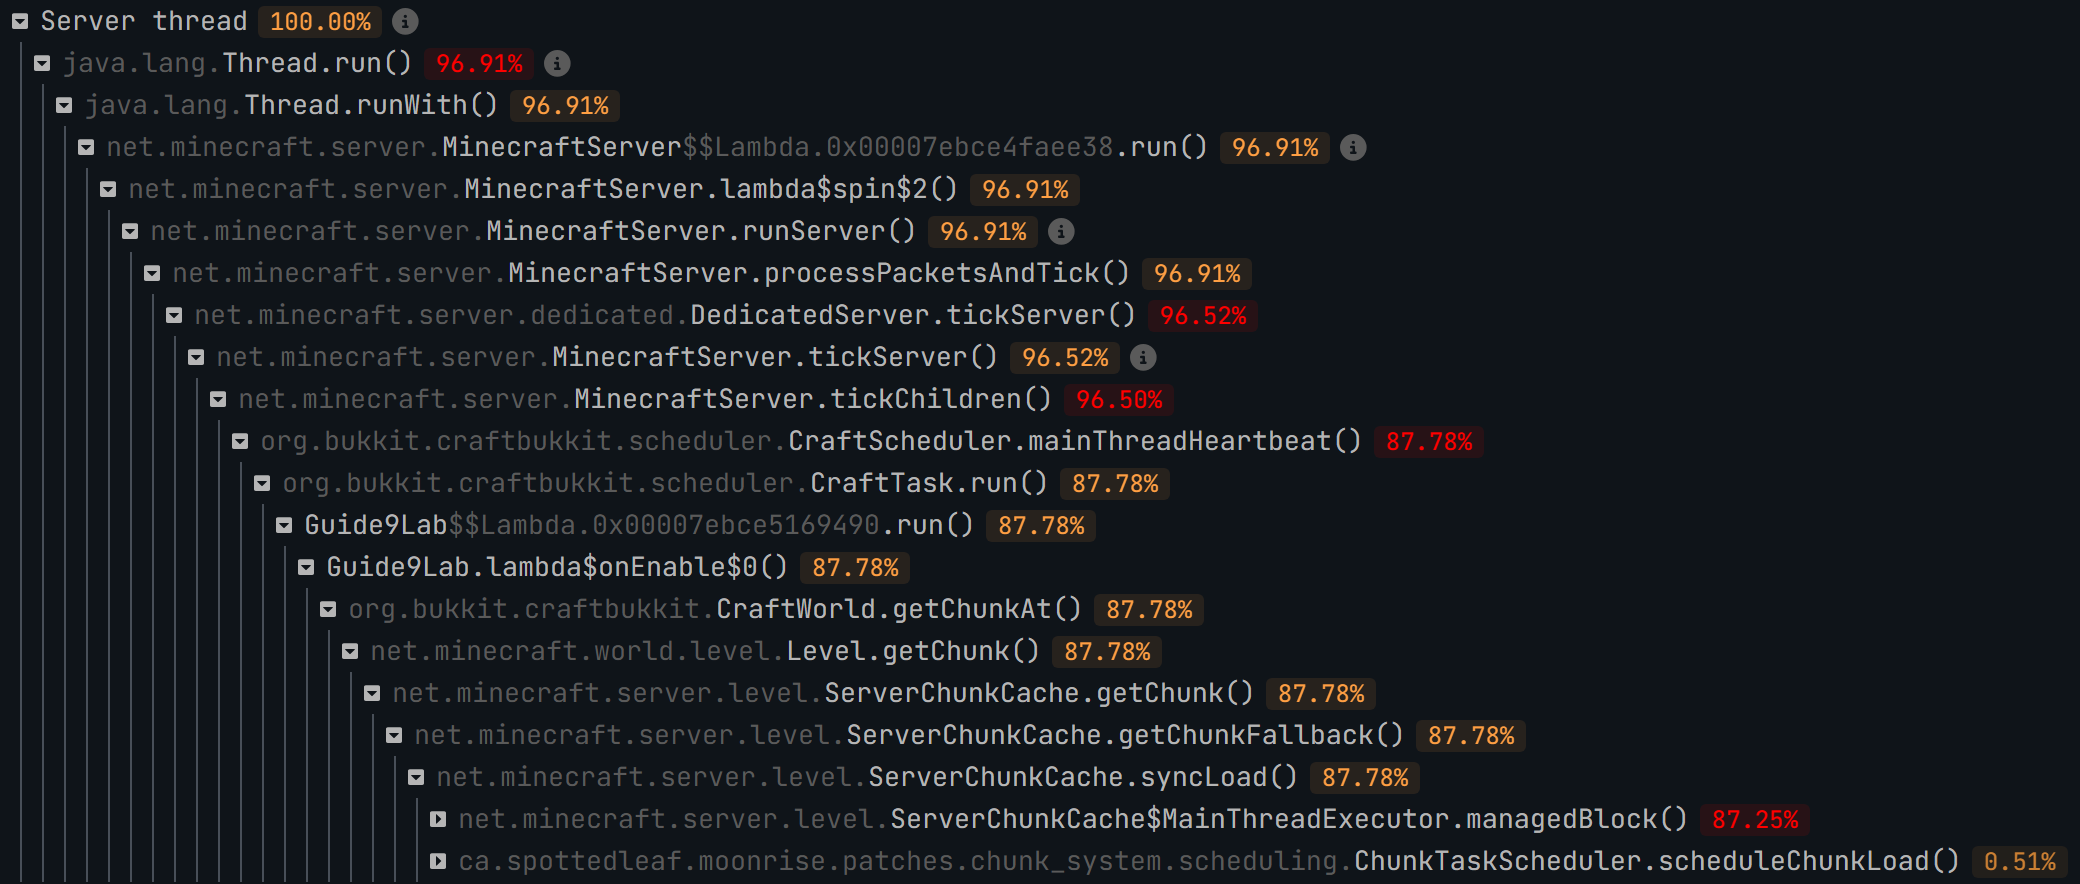
Guide9Lab), the path leads down to syncLoad (87.78%). Almost all of that is waiting in managedBlock (87.25%). Our own lab profile from October 29, 2026, with the search term “syncload”; click the image to open it at full size, and on narrow screens you can scroll it sideways.After switching it off, the same setup ran 961 ticks in 48.2 seconds. The chunk path had practically disappeared: 1.6% of the server thread in ServerChunkCache.tick, and only milliseconds in the workers. The follow-up measurement confirms the mechanism: synchronously requested new chunks block the tick. It does not measure the effect of a smaller view distance, nor real exploration with players; for that, you need the comparison over the same route described above.
One detail shows why time windows matter: at the end of the follow-up measurement, /spark tps still showed 9.65 TPS for the “1m” value, even though almost exactly 20 ticks per second ran within the window itself. The rolling value still included the load phase before it.
Case Study B: Entity Load at a Farm
A diagnostic exercise, with our own lab measurement at the end of the section. Delays occur near a farm. Other places seem fine. The first suspicion is lots of animals, mobs, items, or other entities. But “lots of entities” is not yet a complete explanation: type, behavior, proximity to one another, and active processing are what matter.
Compare in a Controlled Way, Don’t Just Count
Record a report with the farm in its normal state. Note where the players are standing and which areas are active. Then compare against a controlled pause of a single farm function, if that is possible without losing data. A test copy is especially useful if the experiment would otherwise change animals, items, or progress.
If you simply walk far away, you change several conditions at once: active chunks, possible spawns, local plugin actions, and often the visible entities. That can be a good first clue, but it doesn’t cleanly separate these causes. Note this limitation instead of immediately deriving a fixed upper limit for all farms from the result.
Finding the Expensive Part of the Behavior
Look for entity processing in the profile and follow the sub-paths. Movement decisions, pathfinding, or collisions can be interesting, for example. Not every version names them the same way. Also check whether plugin calls are attached to entity events. A farm may merely be the trigger, while a plugin does extra work on every event.
A high share of entity work can be normal on an otherwise healthy server. Only together with the problematic tick times and a reproducible connection does it become a solid suspicion. The question is not “Which branch is the biggest?” but “Which branch explains the observed overload under these conditions?”
Fixes Without Losing World Data
Before you change global limits, try reducing the active load at the affected build: for example, by switching off a feeder or splitting up densely packed areas. Which measure makes sense depends on the actual mechanism. A blanket command that deletes all entities is not a diagnostic tool and can destroy valuable animals, vehicles, or items.
A lower simulation distance can mean less work, but it changes where mechanics stay active. Redstone and farm players in particular therefore need to check that things still work, not just that a number looks nicer. Paper’s world configuration contains further entity settings, and changing them can affect gameplay. Don’t copy someone else’s list of values without checking it: Paper World Configuration.
Success criterion: With the same player count, the same location, and the same test duration, the tick distribution improves repeatedly while the intended farm function stays intact. Switch the tested function back on in the safe test environment. If the pattern returns, that strengthens the explanation. If it doesn’t come back, look for other differences before you call the case solved.
Our Lab Measurement
In the lab, 500 villagers stood packed tightly in a permanently loaded chunk. For the follow-up measurement, the test plugin removed exactly these 500 entities it had spawned itself, and nothing else.
| Measurement window | Entities | Ticks in window | Ticks per second | Tick duration, last 10 s (median / 95th percentile / max) |
|---|---|---|---|---|
| 500 villagers (48.5 s) | 508 | 491 | 10.1 | 58.5 / 107.0 / 157.7 ms |
| Villagers removed (48.1 s) | 8 | 960 | 20.0 | 0.3 / 0.5 / 6.1 ms |
In the load profile, 87.1% of the server thread’s sample time went to Villager.tick, reached via ServerLevel.tick → EntityTickList.forEach → tickNonPassenger. Most of that was the villagers’ AI: Brain.tick came to 55.5%, including 10.8% for the sensor for nearby living entities (NearestLivingEntitySensor). Pushing each other around (LivingEntity.pushEntities) accounted for 11.7%. Both paths plausibly relate to the number of nearby neighbors. We did not measure whether spreading the same 500 villagers out more loosely helps.
In the viewer, searching for “brain” leads straight to this path. The many intermediate steps such as Mob.tick and aiStep belong to general entity processing; the path only becomes telling at Villager.tick and Brain.tick.
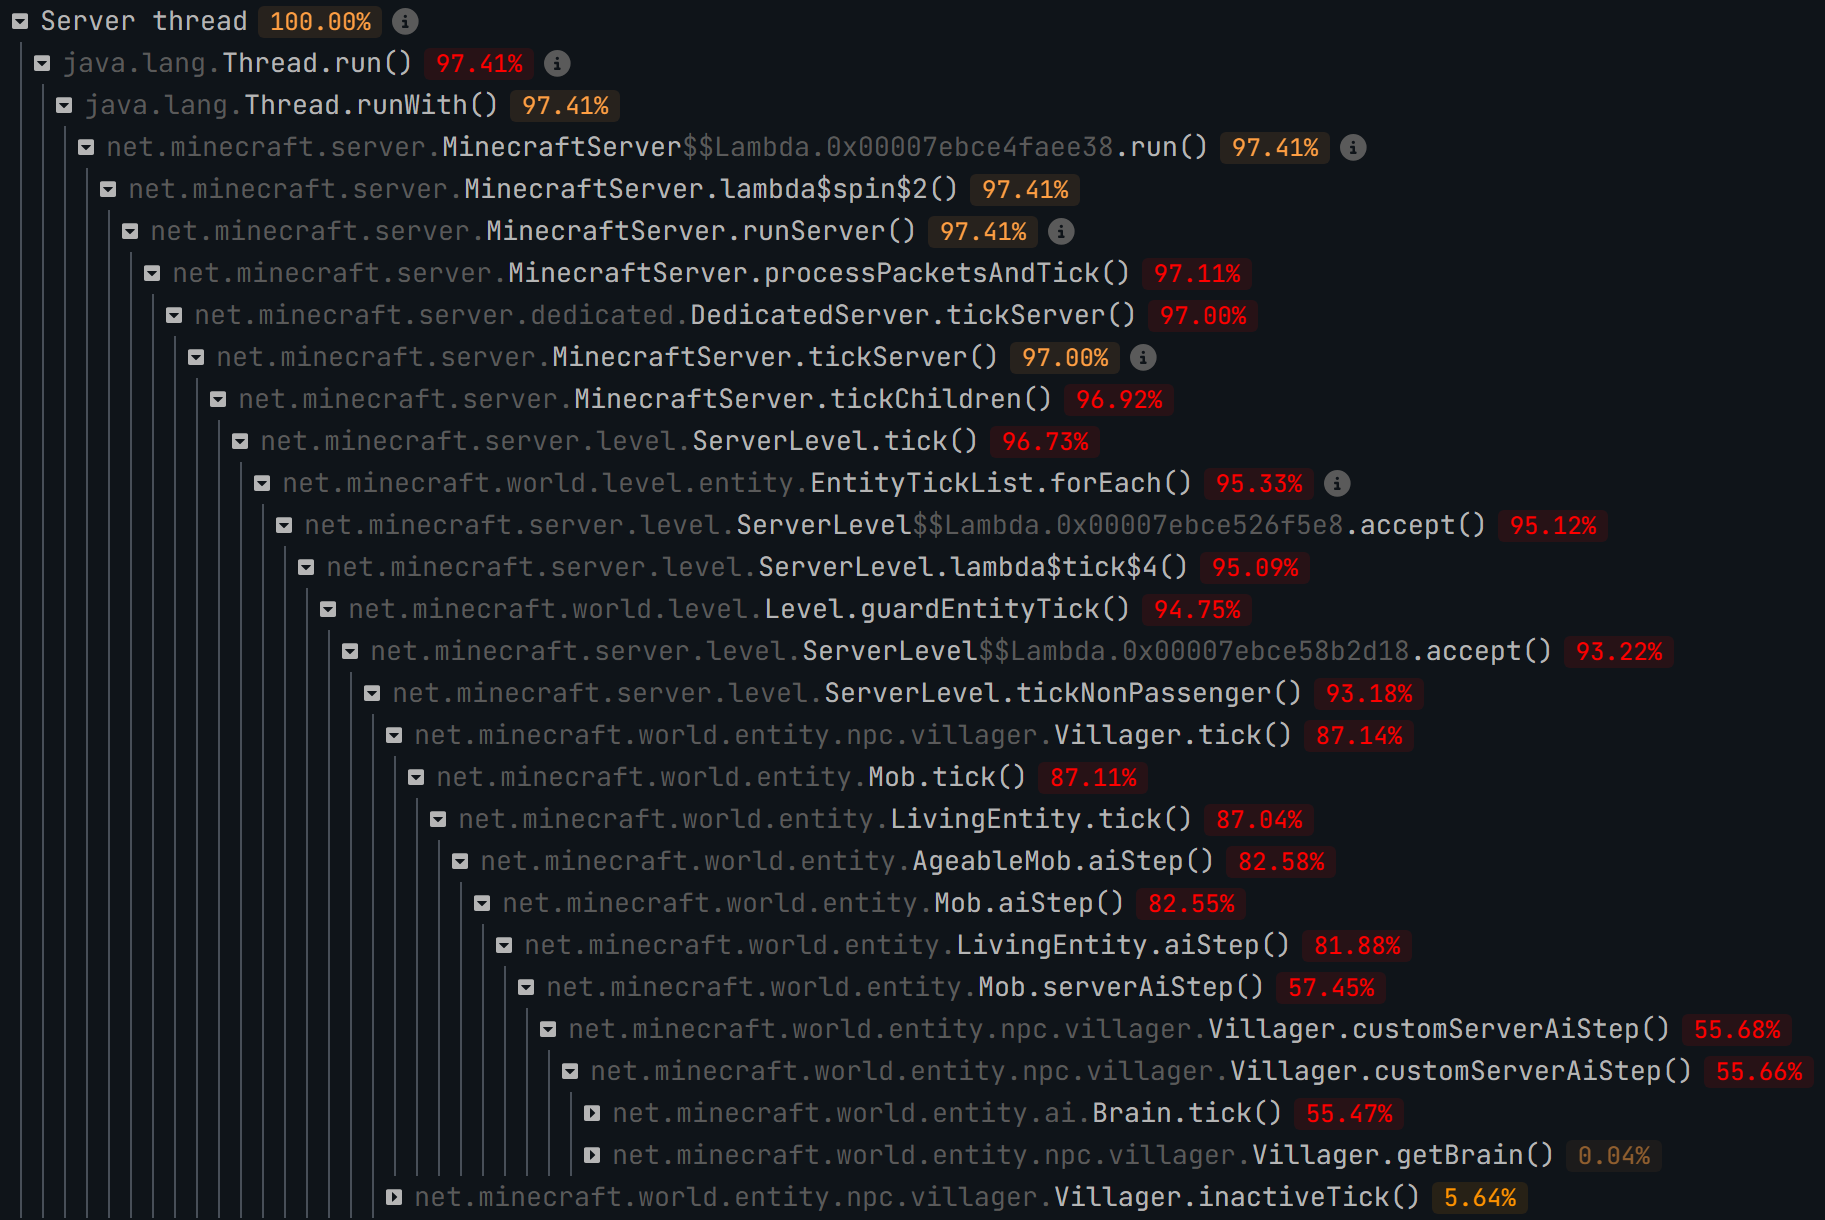
Villager.tick accounts for 87.14% of the server thread, including Brain.tick at 55.47%. Our own lab profile from October 29, 2026, with the search term “brain”; click the image to open it at full size, and on narrow screens you can scroll it sideways.The load was not even. Shortly after spawning, /spark tps still reported short ticks; toward the end, the median of the last ten seconds was 58.5 ms. A single glance at the readout could have given a completely different picture depending on the moment. After removal, the server was back at 20 ticks per second within the window, and Villager.tick no longer appeared in the profile. That confirms only the link to exactly these entities, not a general limit for farms.
Case Study C: A Plugin Doing Constant Work
A diagnostic exercise, with our own lab measurement at the end of the section. The server stutters regularly, even though nobody is exploring new areas. In the report, a plugin path shows up under a scheduled task or event. The hypothesis is an expensive plugin feature, for example repeatedly scanning many objects or a slow dependency.
Keep the Whole Call Path
Don’t save just a plugin name cut out of context. Document which parent task or event leads into it and which child calls make up the share. A plugin can trigger an expensive server action without doing many computation steps of its own. Conversely, a general Minecraft method can be triggered by a plugin call.
The Sources view helps you get started. Then compare against the full tree so the context isn’t lost. A list of installed plugins proves no cause; neither does a mere name in a profile. Look for a reproducible action or a timing pattern that matches the path in question.
Test Safely Instead of Removing Things at Random
Back up the world, plugin configurations, and related data. Check dependencies before you disable a plugin for a test. Some plugins protect areas, manage inventories, or modify world data. Removing one without checking on the live main server can do more damage than the original lag.
To narrow things down, Paper describes comparing separate groups of plugins and points out dependencies that belong together. Where possible, such tests belong on a protected test copy. Stop the server cleanly before changing files, and don’t use a blanket reload as a substitute for an orderly test. Source: Paper: Plugin-induced issues.
If a single feature can be limited in the configuration, that is often the better first attempt: for example, an interval or the scope of a scan. For that, read the documentation for exactly this plugin and this version. There is no universal “spark fix” you can enter for every plugin.
Success criterion: With exactly one feature changed, the problem improves under the same load; when you switch back in a controlled way, it reappears. Also test whether the plugin’s actual feature still works correctly. A bug report to the developer should include versions, reproducible steps, the complete relevant call path, and both measurements together. Publicly blaming someone without that basis helps no one.
Our Lab Measurement
In the lab, the test plugin ran a scheduled synchronous task every tick. It looped for about 65 ms, constantly reading the clock until the time was up. For the follow-up measurement, exactly this task was switched off.
| Measurement window | Duration | Ticks in window | Ticks per second | Tick duration, last 10 s (median / 95th percentile / max) |
|---|---|---|---|---|
| Task on | 48.2 s | 714 | 14.8 | 65.6 / 73.2 / 99.2 ms |
| Task off | 48.1 s | 961 | 20.0 | 0.3 / 0.4 / 0.8 ms |
In the load profile, 97.3% of the server thread’s sample time sat in a single path: CraftScheduler.mainThreadHeartbeat → CraftTask.run → the test plugin’s task. So the call path names both the trigger, a scheduled task, and the culprit. The math checks out: a task of about 65 ms per tick blows the 50 ms budget, so no more than about 15 ticks per second are possible. We measured 14.8. After switching it off, 961 ticks ran in 48.1 seconds, and the path had disappeared from the profile.
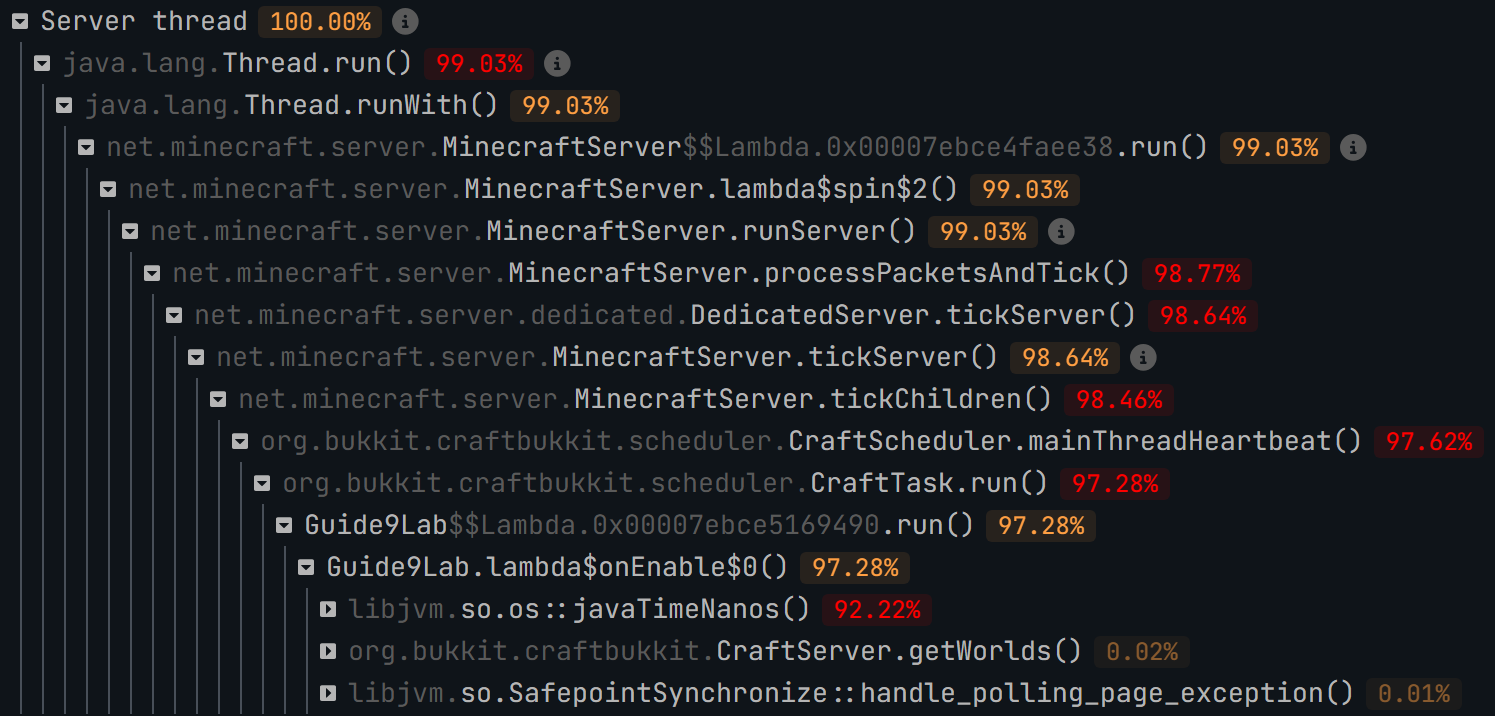
mainThreadHeartbeat and CraftTask.run, the path leads into the test plugin’s task (97.28%). Below it is the test loop’s clock read, os::javaTimeNanos (92.22%); the next paragraph explains why it is not the cause. Our own lab profile from October 29, 2026, with the search term “guide9lab”; click the image to open it at full size, and on narrow screens you can scroll it sideways.The excerpt holds one more lesson. At the very bottom is os::javaTimeNanos at 92.2%, a function of the Java runtime that reads the clock. That is our test loop’s clock read, not the cause. The deepest node shows what the processor was busy with at that moment, but not who caused the work. So read from the bottom up until you reach a node you can change: here, the test plugin’s scheduled task. In a real profile, that is often the first node with a plugin’s package name.
A real plugin rarely shows such a clean single path. Often the work is spread across events and server calls, as described above. Our measurement shows what the call path looks like when the attribution is unambiguous.
Measuring Again: When Is an Improvement Credible?
A successful optimization needs more than a green screenshot. Before the change, define which observation should improve. For short freezes, what counts is how often they happen and how long they last; for constant overload, the tick distribution under the same load. For client problems, matching client-side measurements count. A number from the wrong system is still the wrong number after the change.
Use the same procedure for each of the three cases:
- Document the starting state and reproduce the problem.
- Save a profile during the problem; for spikes, also take a filtered measurement.
- Formulate a reasoned hypothesis with a specific path.
- Test exactly one reversible change.
- Recreate a comparable load and measure again.
- Check for side effects in the game and record the result along with its uncertainty.
Repeat a promising comparison if time-of-day load, caches, or random events could affect the result. The first run after a restart is not automatically comparable to a long-running server. Switching to different hardware also changes several variables at once. That can help in practice, but it is not clean proof of “not enough RAM.”
Make sure both measurement windows lie entirely within their condition. In our lab, at the start of the plugin follow-up measurement, /spark tps still showed a median of 65.4 ms for the “1m” value, even though the last ten seconds were already at 0.3 ms. The most reliable source is the saved profile itself, because it applies to exactly its own time window.
Record individual values, not just an average. Also write it down when a test was not comparable, for example because a player left the farm. Don’t quietly discard an unfavorable run. A measurement log with an explained gap is worth more than a seemingly perfect before-and-after number.
When spark Doesn’t Give a Clear Answer
An unremarkable profile at first only means that no matching finding turned up in this recording. Check the time window and filters first. With rare spikes, the relevant tick may be missing; with excluded threads, the decisive work may lie outside the recording. Another profile should close a specific gap in the measurement, not just happen to repeat the same conditions.
If the server process looks normal but all players experience hitches at the same time, add simultaneous observations of the host and the connection. Look at things like disk problems, other system load, and the network path. The server owner or hosting provider can supply additional information for this. A host’s total CPU usage alone isn’t enough either: a single decisive thread can be maxed out while other cores stay idle.
In the event of a crash, the crash report or server log also matters. A profiler report replaces neither a specific error message nor its timing context. Preserve this information before any further restarts or changes. Don’t pass on sensitive data without checking it, and share only the excerpt needed for the investigation at hand.
Quick Checklist
Before the profile: describe the problem, note the time, cross-check the client and connection, record versions. During the profile: actually trigger the problem, don’t overwrite someone else’s measurement, log other activity. When reading: check the tick distribution, pick the right thread, follow paths, mind what the percentages refer to. After a change: repeat the same load, check for side effects, keep a way back.
A good summary for your server owner might read: “When exploring new areas, block actions are delayed for all three players. In the existing area, this did not happen during our comparison. Here are the exact time windows and both reports. The view distance was unchanged.” This is a template, not a report on a test carried out here.
Glossary: The Terms in the Report
Tick: One step of the game simulation. TPS: The number of such steps per second. MSPT: The duration of one step in milliseconds. Median: The middle value of the sorted measurements. 95th percentile: A threshold below which roughly 95 percent of the values lie. Thread: A strand of execution in the program. Call tree: A nested view of which function calls which other function.
Heap: The memory area for Java objects. Garbage collection: Cleanup of objects that are no longer needed. Chunk: A spatial section of the world. Entity: A moving or independently managed game object, such as an animal or an item. Profile: A time-limited sample of program execution. Follow-up measurement: A comparison after a change under conditions as similar as possible.
Sources and Last Review
Checked on November 1, 2026: Paper Profiling, Paper Troubleshooting, spark commands, spark viewer, TPS and MSPT, lag spikes, server.properties, Paper global configuration, and world configuration. The help of the version you actually have installed remains authoritative. The diagnostic exercises and comparison procedures are editorial guidance. Our own measurements come exclusively from the lab described above, dated October 29, 2026; raw profiles, time windows, and checksums are in the measurement log.
Frequently Asked Questions
Why does Minecraft lag with 16 GB of RAM?
Because RAM is only one possible limit. CPU work, individual expensive ticks, client rendering, and the connection can cause problems independently of it. First check which layer is affected. A high allocation doesn’t prove that the memory is being used well or that the process has enough headroom outside the heap.
Can I use spark without my own server?
As a player, you can document the symptom and the time and ask the server owner for a suitable measurement. A server profile requires the appropriate permissions. A client-side spark installation measures in a different place and does not replace the server profile.
Is 20 TPS always proof of a smooth server?
No. Short spikes can get lost in an average. Read the tick duration distribution and match it against the time you observed the problem. At the same time, poor client FPS or a disrupted connection can occur even with healthy server ticks.
Should I immediately remove the plugin with the biggest share?
No. Check the full path, the actual tick problems, and what triggers the work. A large share can contain necessary work. Test a single feature on a safe copy and then measure again.
Should I reduce the simulation distance as far as possible?
Only as a reasoned experiment. It affects the active world and therefore possibly farms and gameplay mechanics. A lower value is not automatically the best setting for your group. Back up the original value and check gameplay as well as the measurements.
What belongs in a helpful support report?
Exact versions, the time including time zone, player count, activity, reproducible steps, and the matching profile. Add the single change you tested and the follow-up measurement. Keep observation and assumption separate. That way, an admin friend, a plugin developer, or any hosting support team can follow up far more effectively.
Editorial review method
The MCRedstone editorial team checked the commands and viewer explanations against the spark and Paper documentation linked in this article, last on November 1, 2026. Our own numbers come only from the three controlled lab cases from October 29, 2026, with artificial load and no players; they are not a hosting or hardware comparison. We review the article again when spark or Paper change the commands or views it describes.